


Investor relations
Preferred partner during the journey towards a cleaner tomorrow
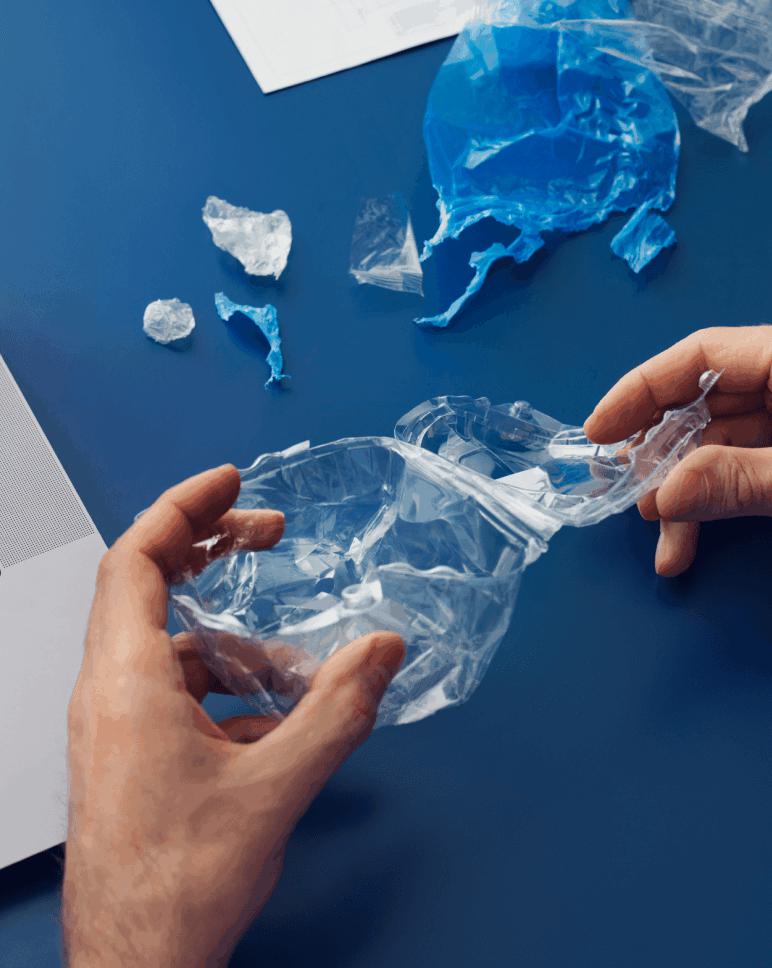
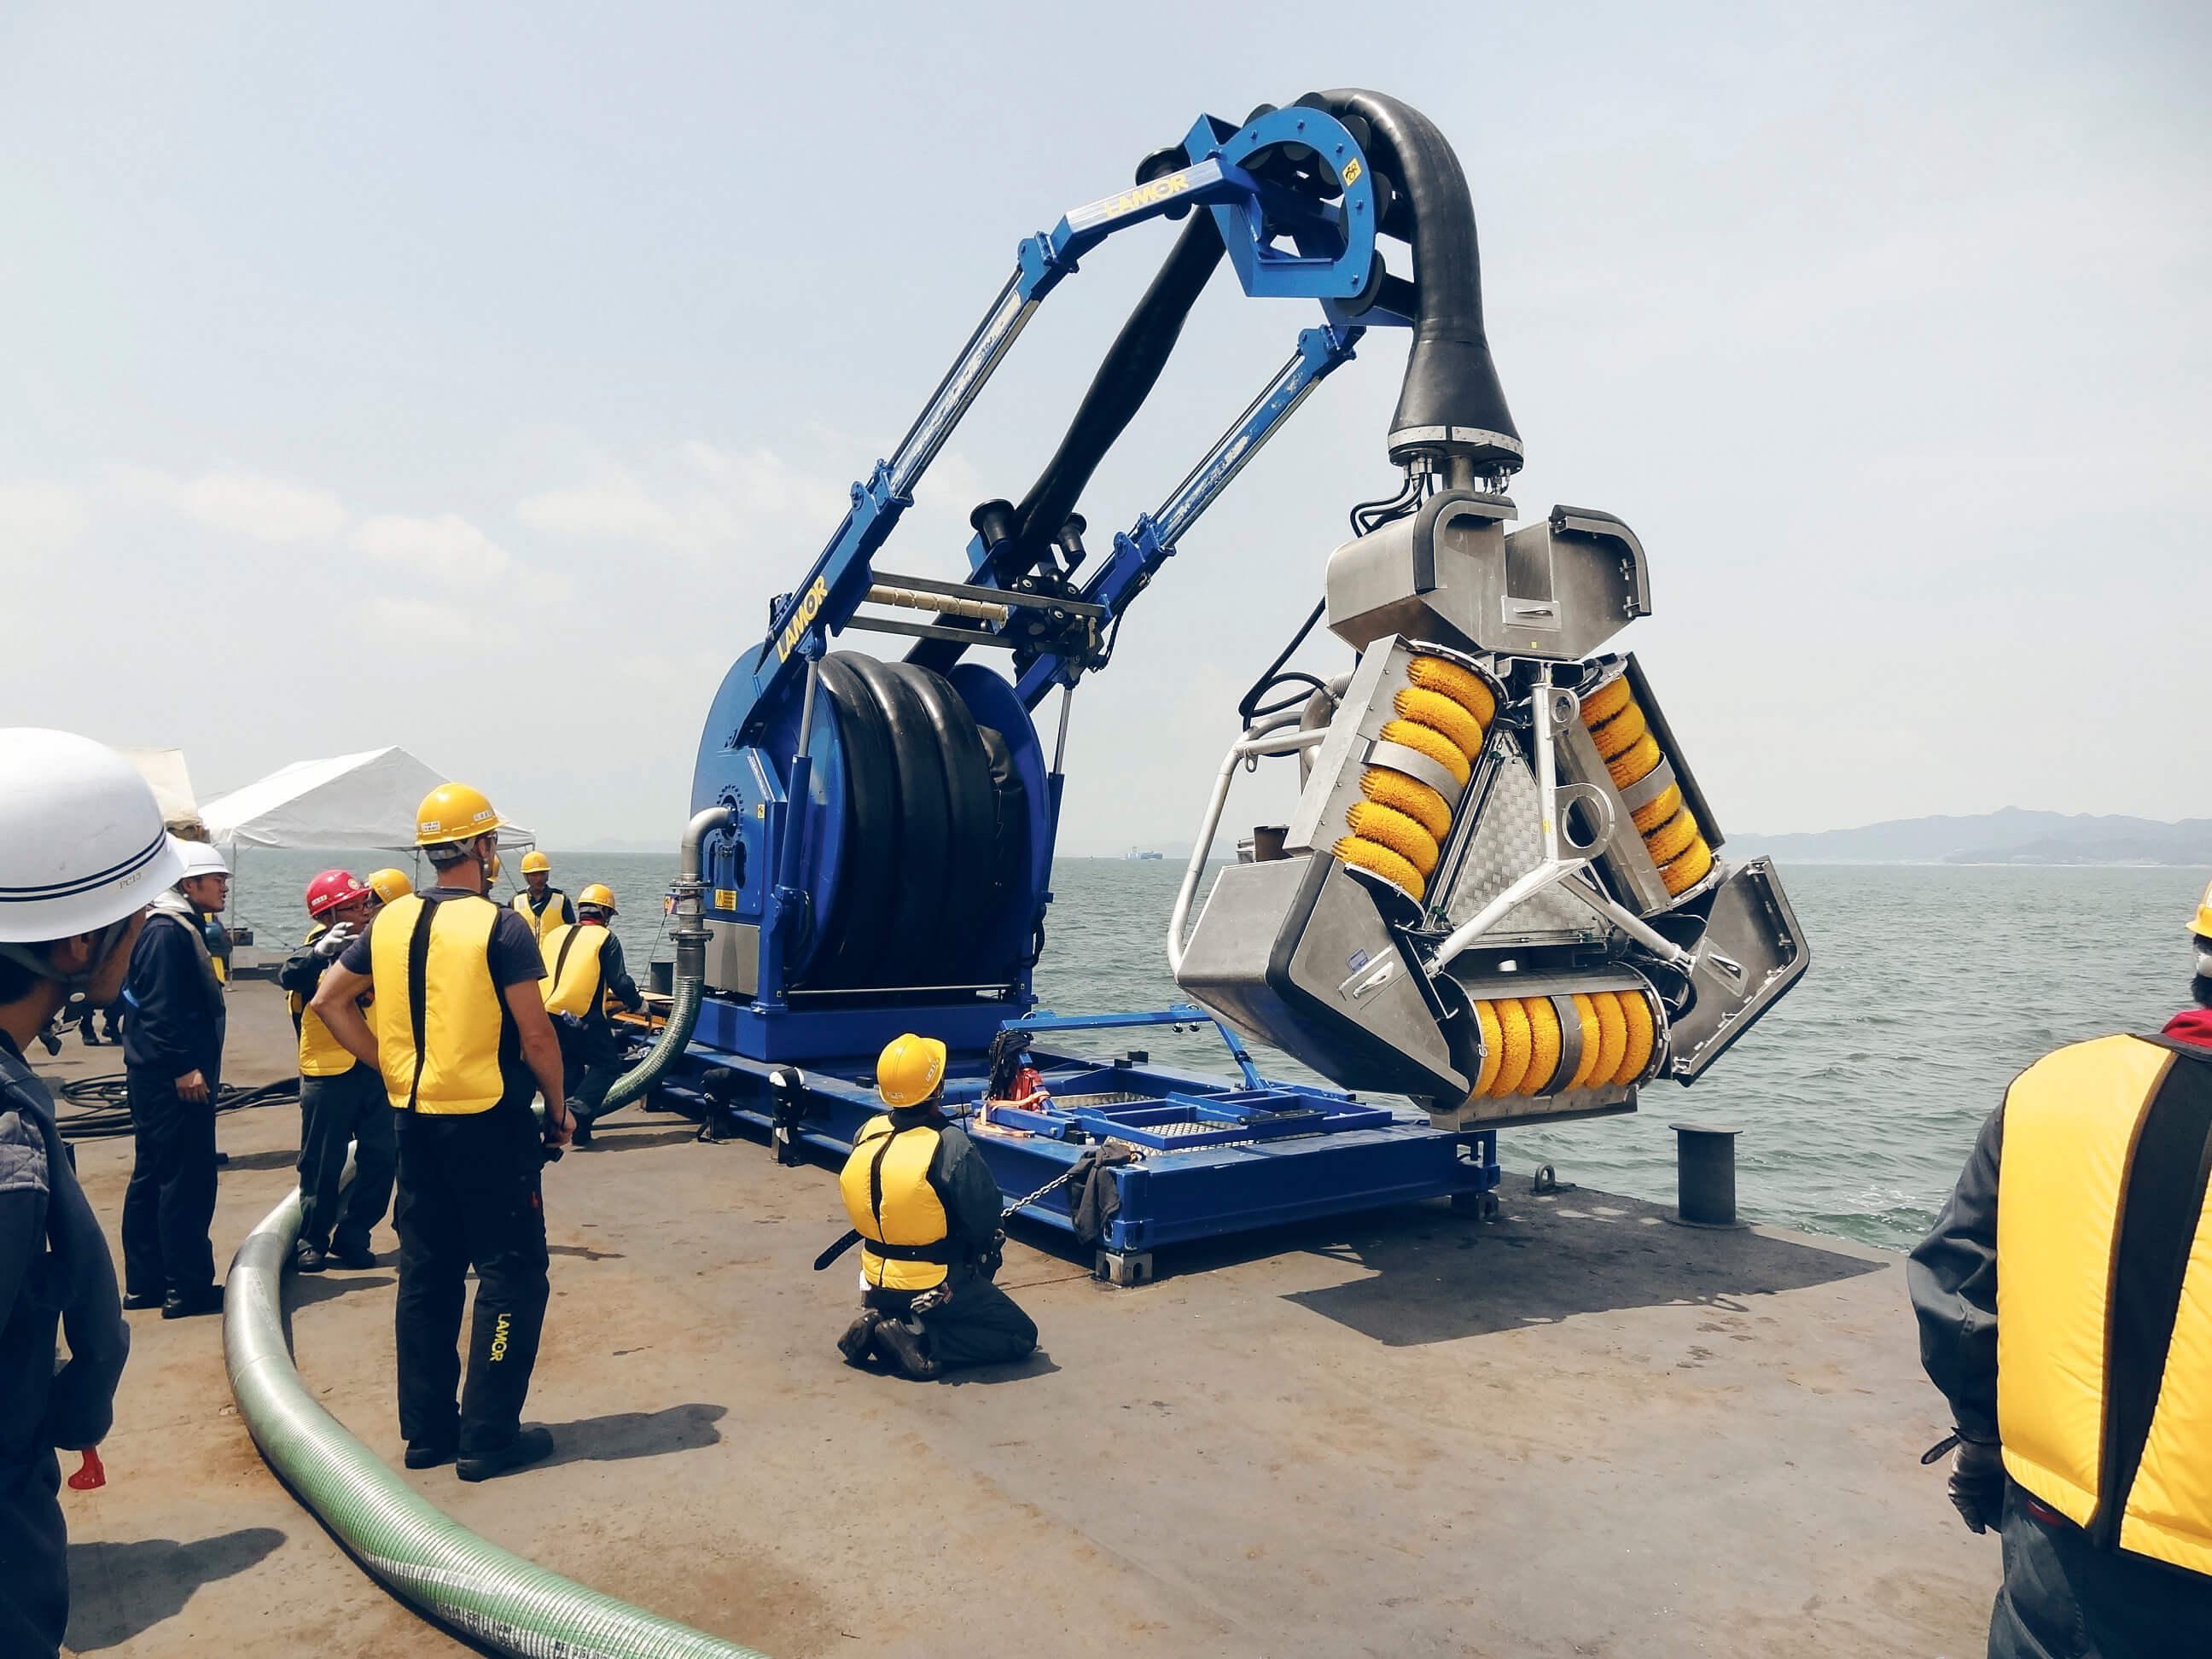
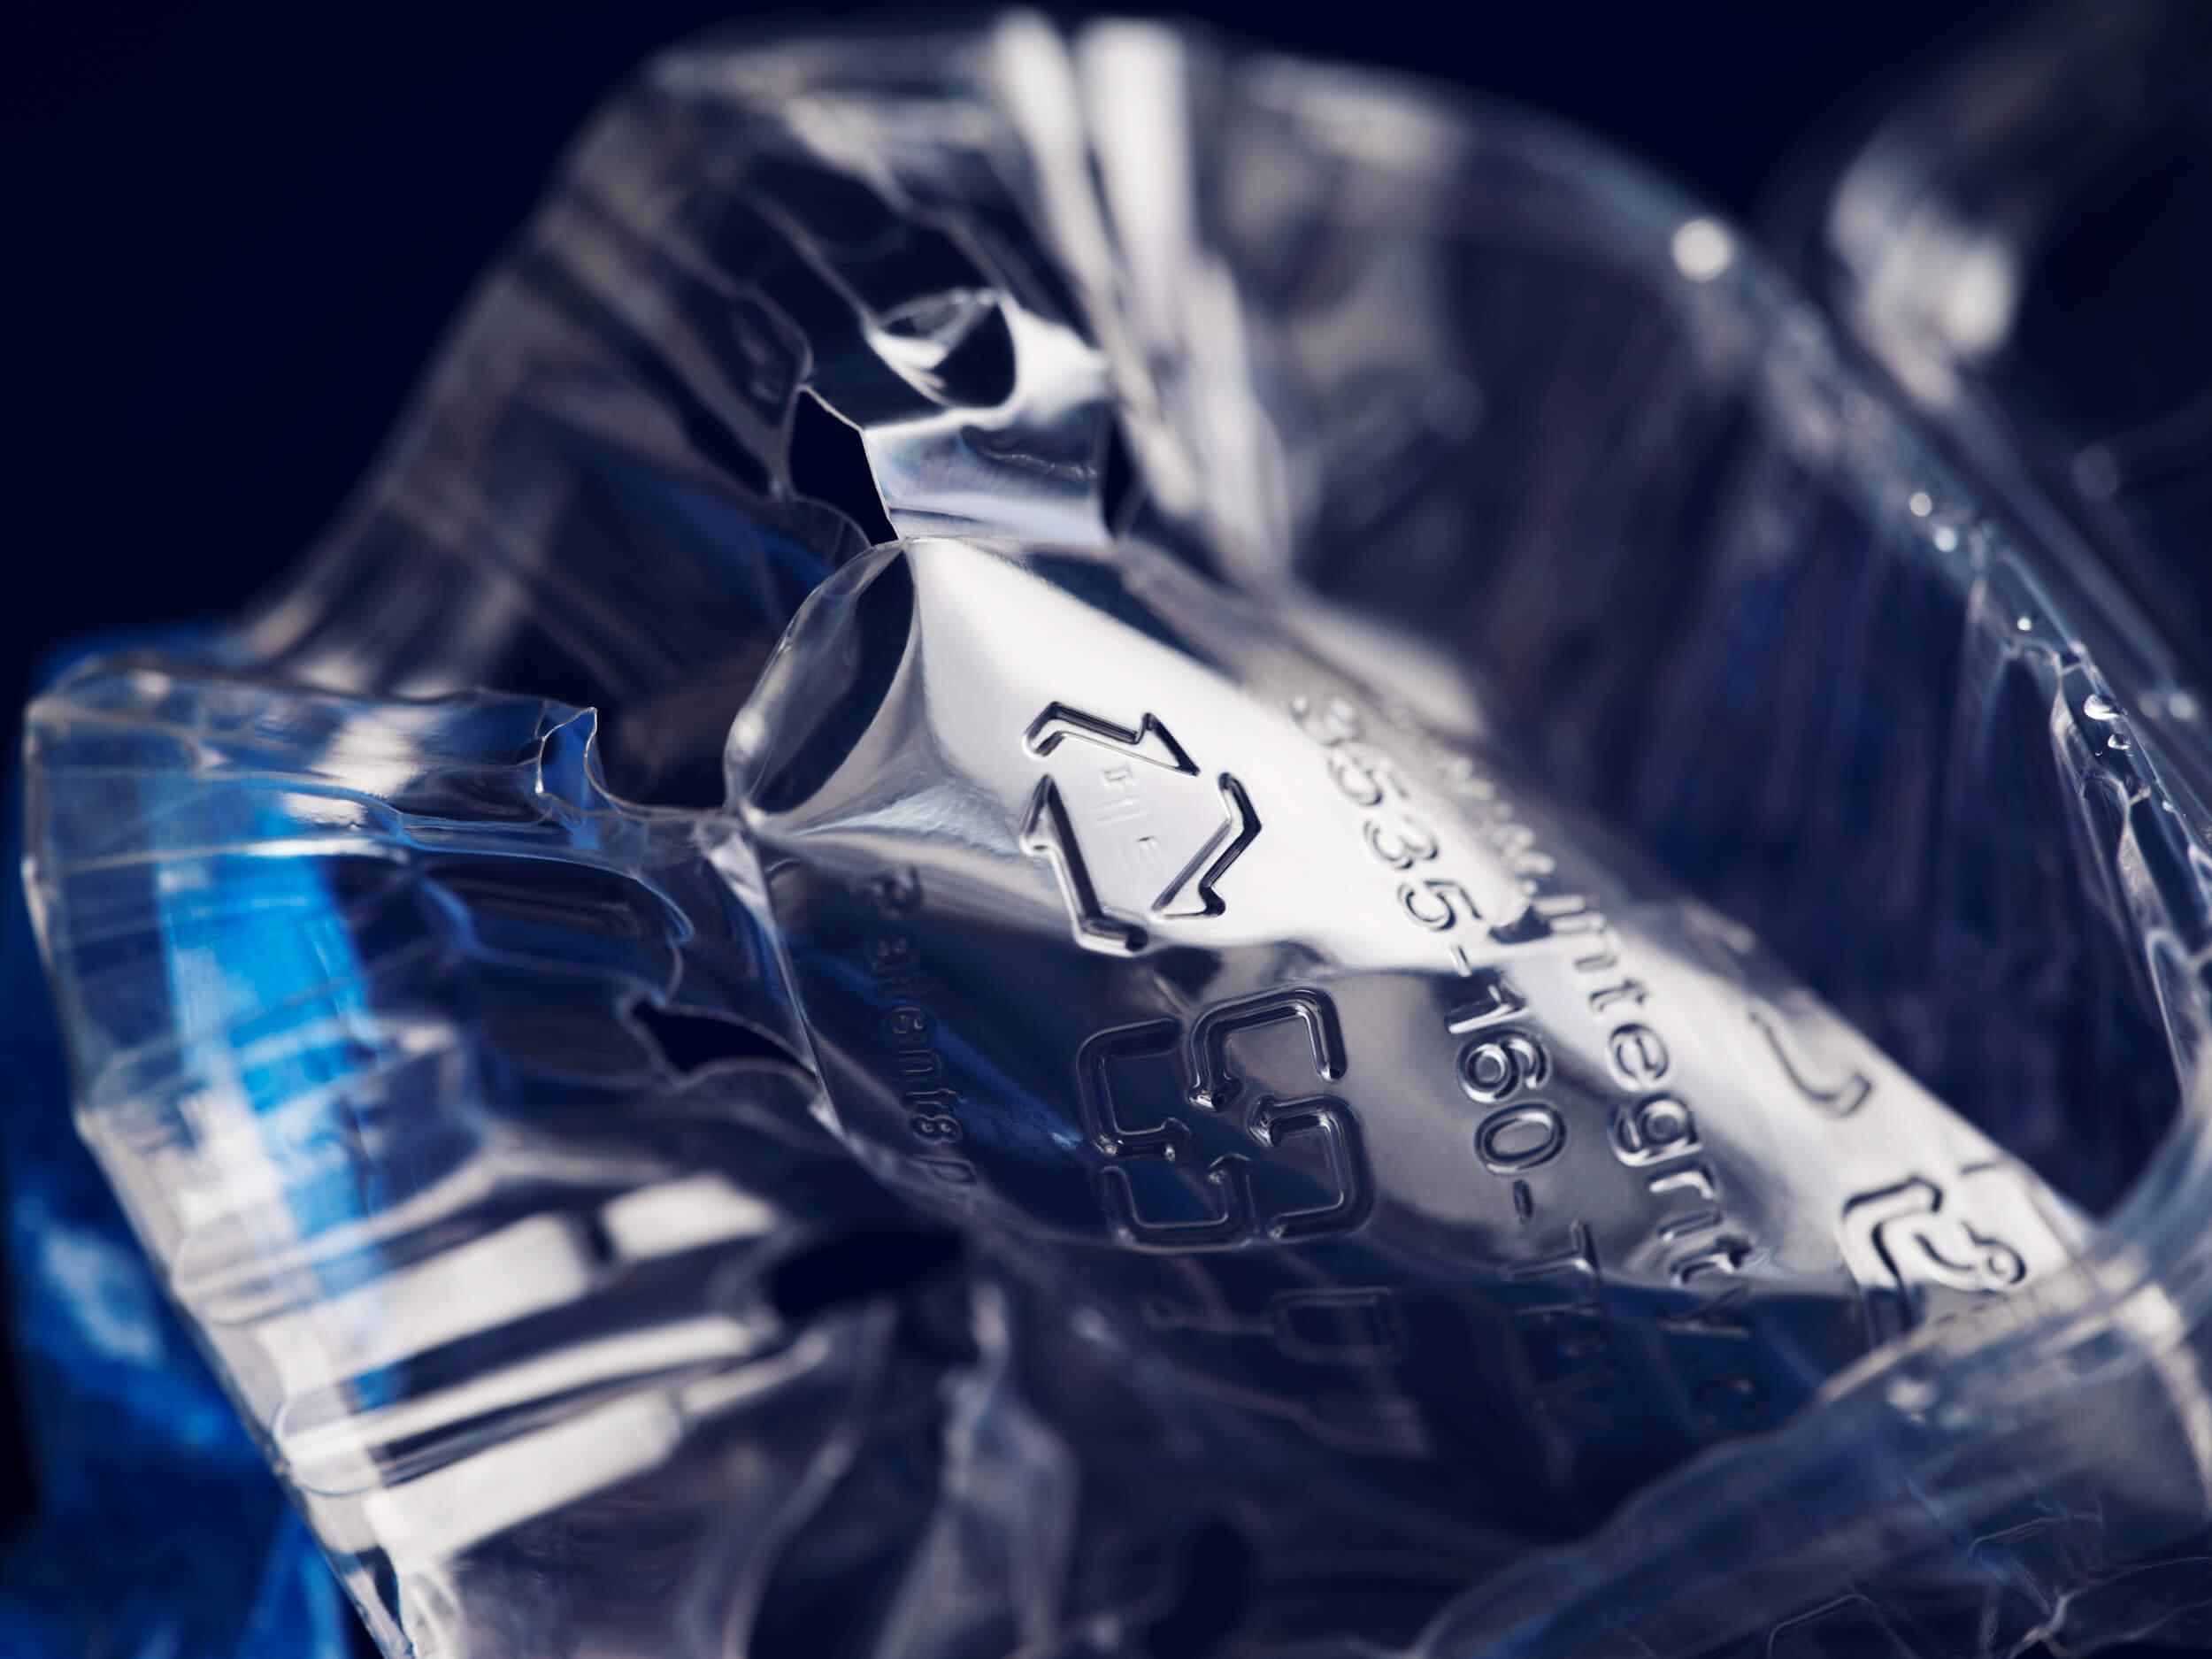
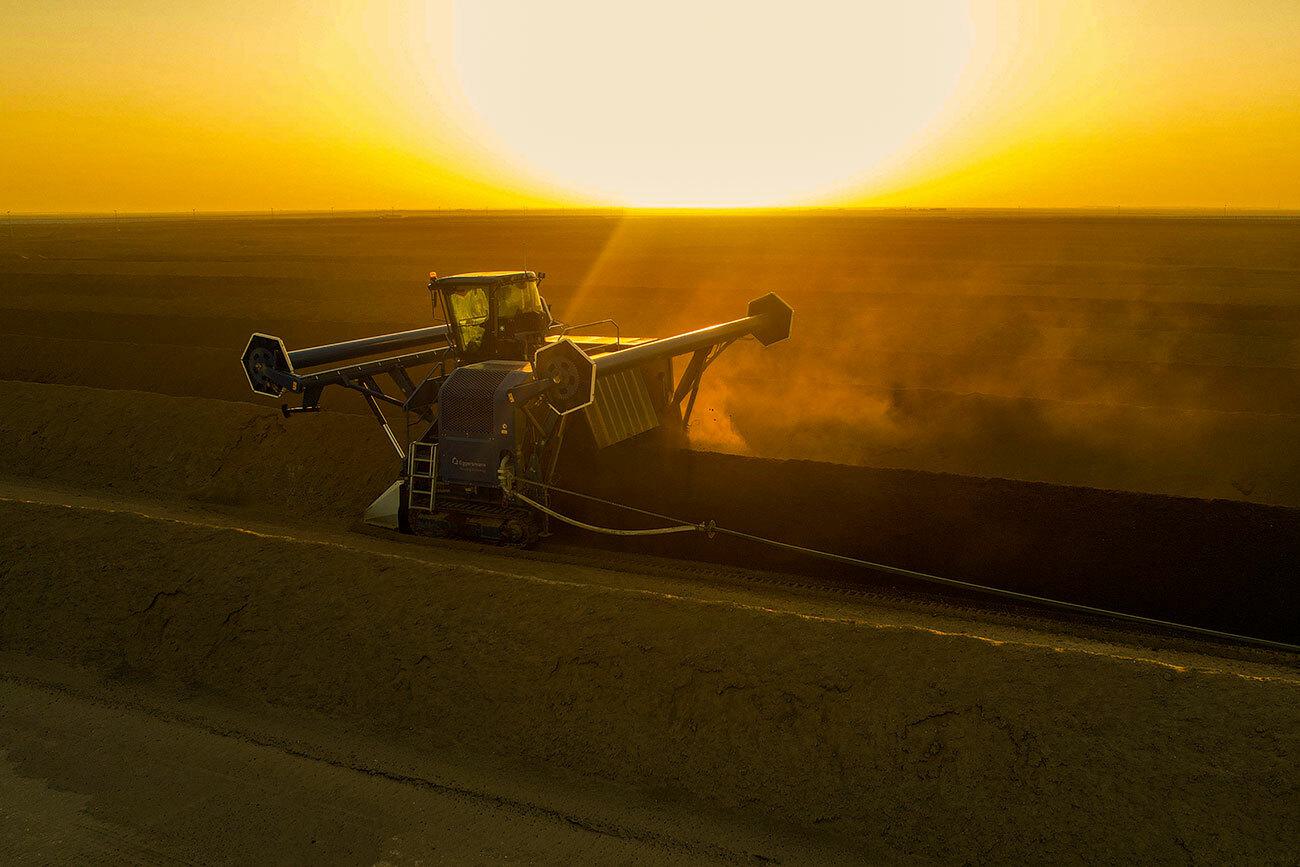
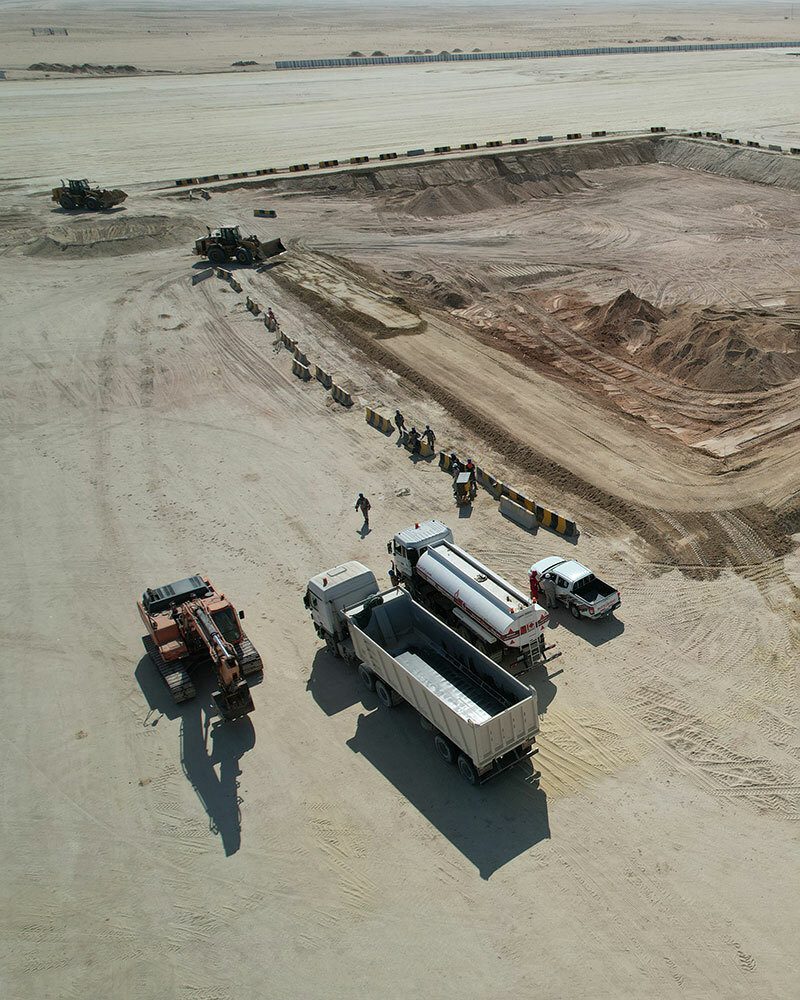
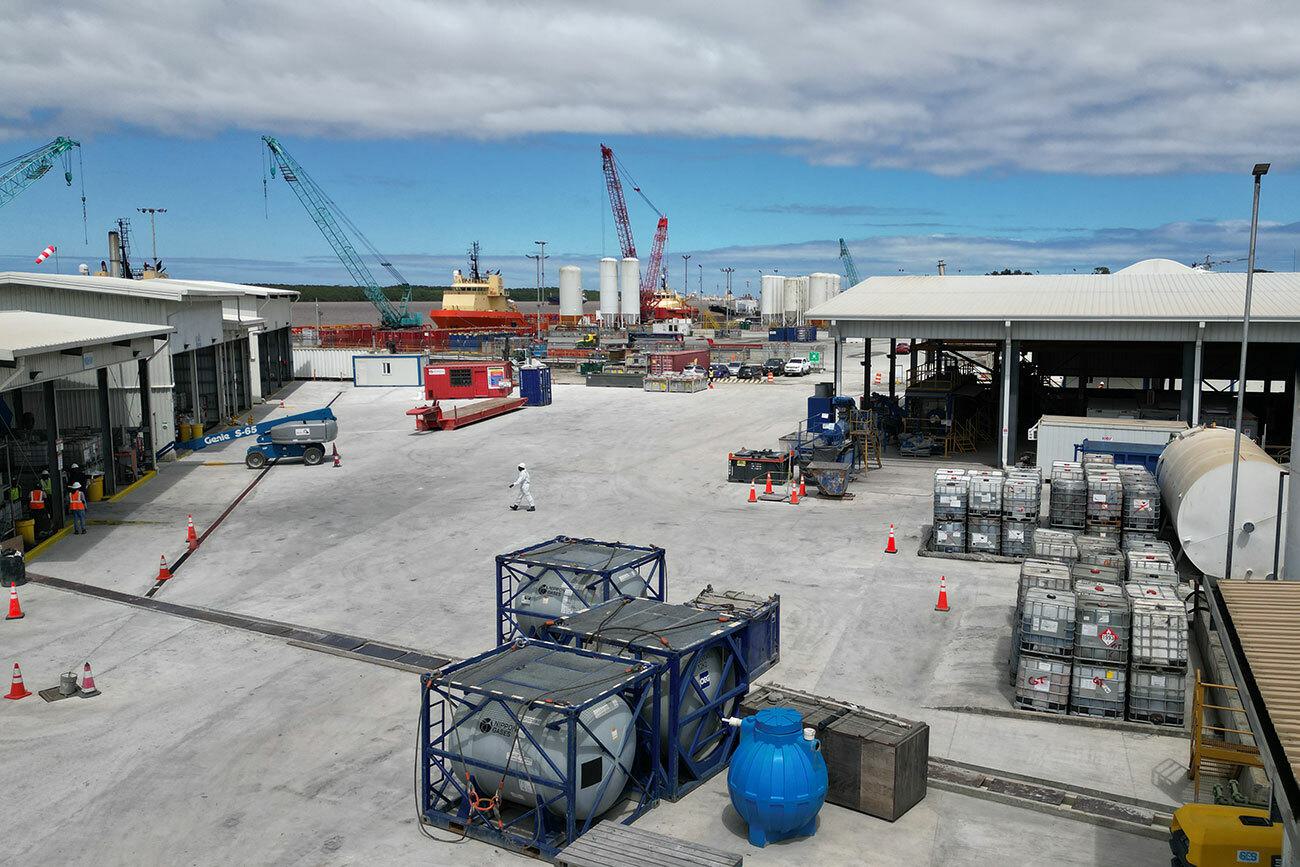
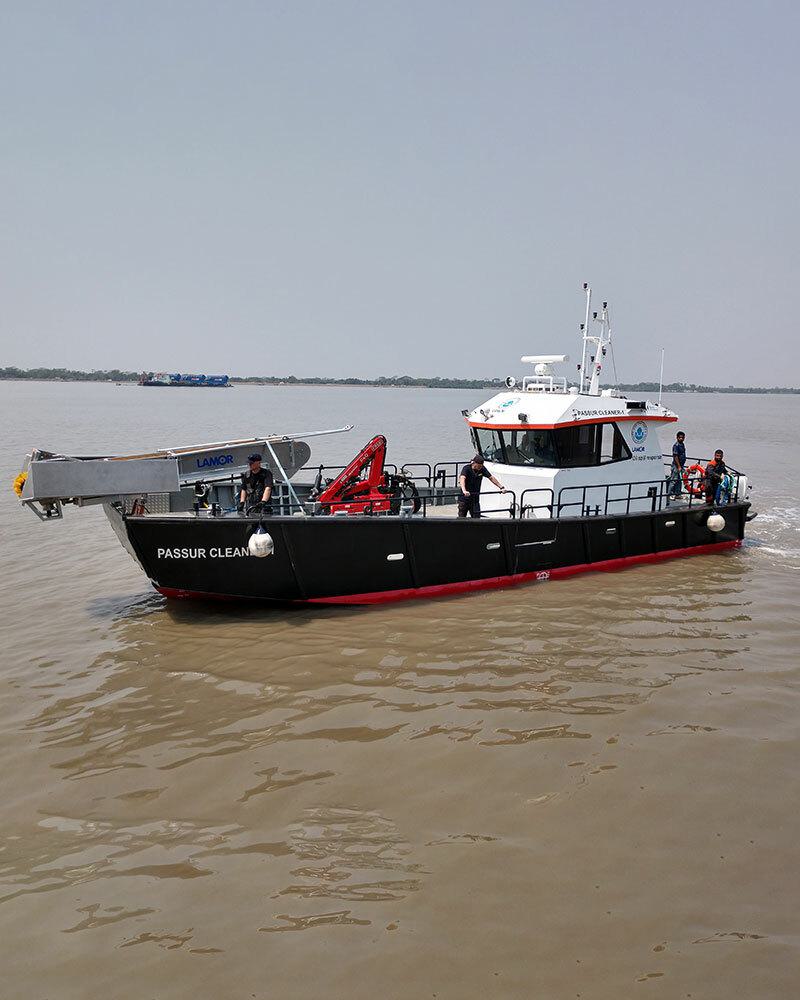
Lamor is one of the leading global providers of environmental solutions. We are specialised in environmental protection, soil remediation, and material recycling to be able to solve huge global problems.
Get our latest press and company releases to your e-mail.
Subscribe hereLamor Last 19/09/2022 10:31 EET Latest € 3.96 Change +0.36€ / +0.36% Volume 12,347
Lamor Last 19/09/2022 10:31 EET Latest € 3.96 Change +0.36€ / +0.36% Volume 12,347
Lamor Last 19/09/2022 10:31 EET Latest € 3.96 Change +0.36€ / +0.36% Volume 12,347
Lamor Last 19/09/2022 10:31 EET Latest € 3.96 Change +0.36€ / +0.36% Volume 12,347

123M€
Revenue 2023
10.9M€
Adjusted EBIT 2023
124M€
Order backlog 31.12.2023
Read about our key figures from 2019-2023
Read more
Strategy
Profitable and sustainable growth - with passion.
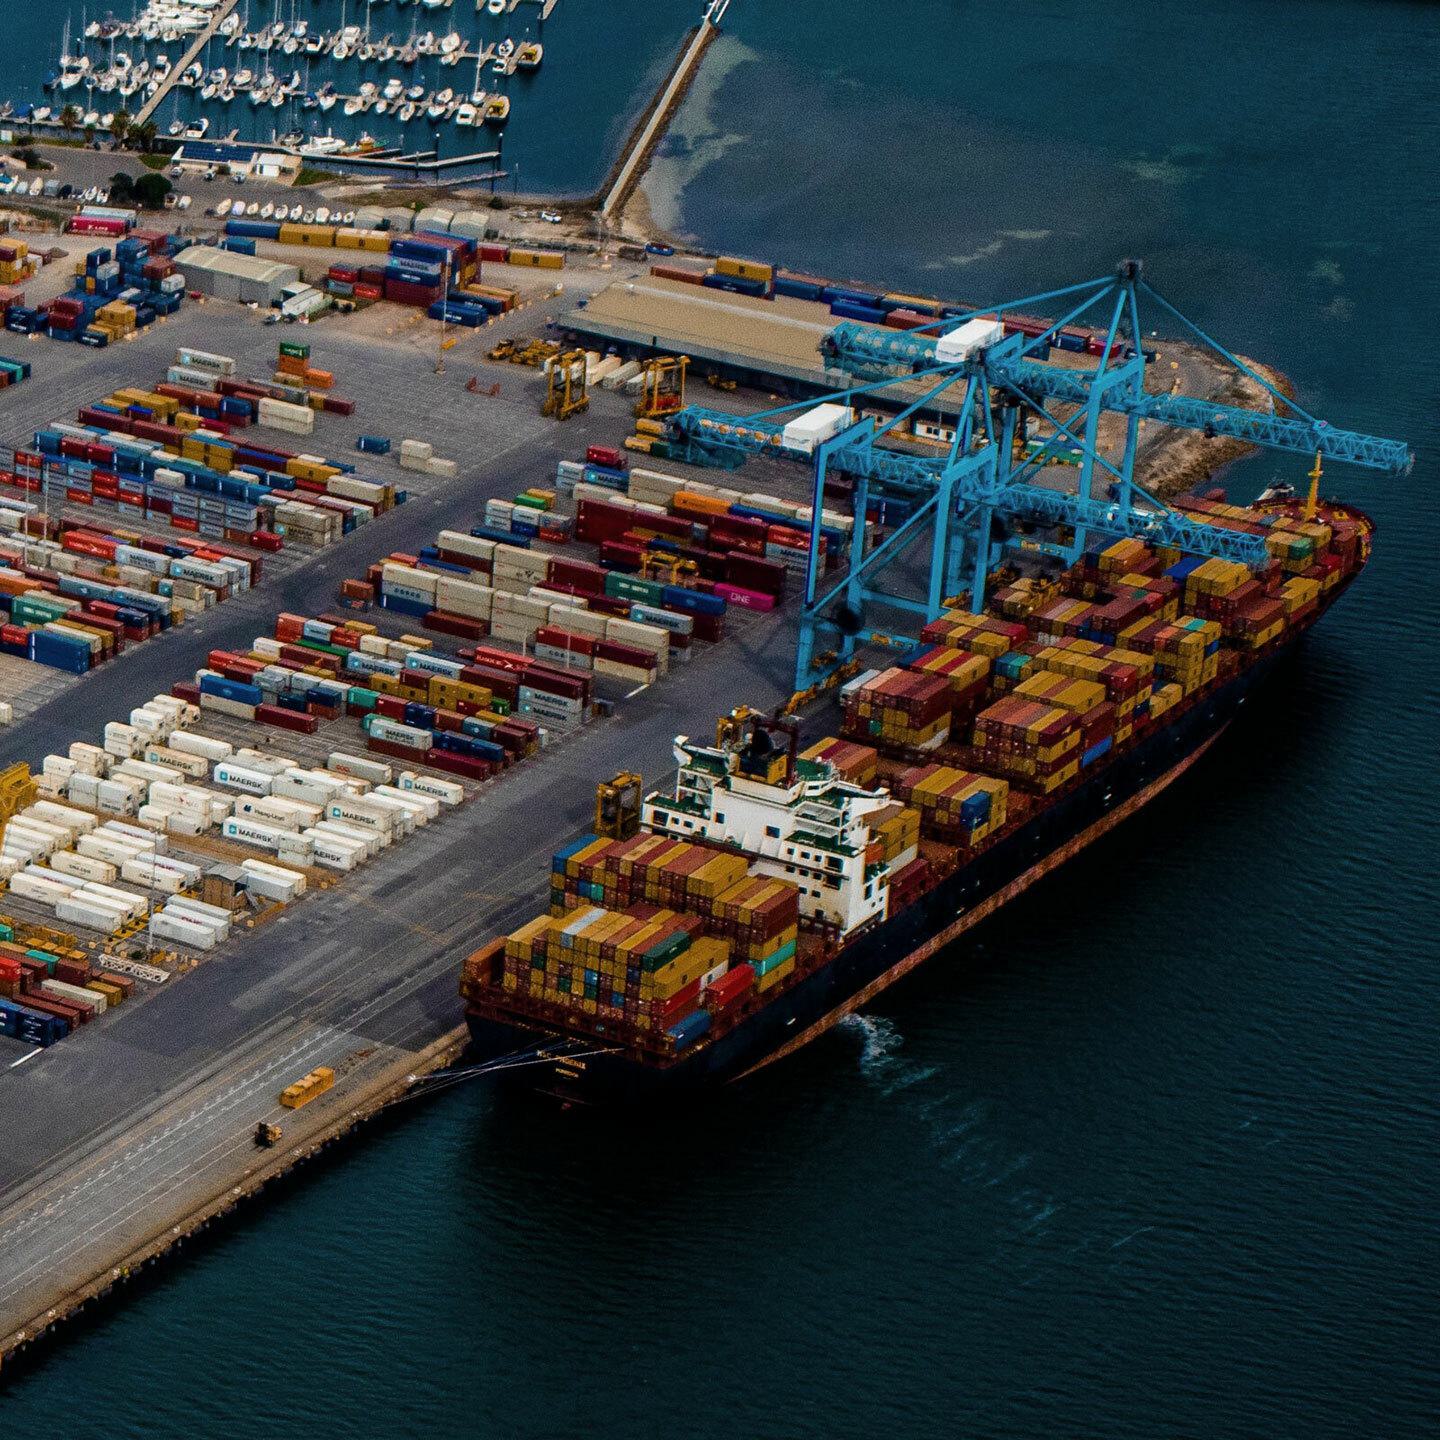
Lamor’s strategy aims for long-term growth and a leading position within selected areas and industries. Together with our partner and customer network we promote circular economy, protection of biodiversity and careful use of scarce natural resources.

Investor relations
Strategy
Our key target is to be the world´s leading provider of environmental solutions and a link to sustainability. Here you will find information on our strategy and markets.
Financial information
Find Lamor's latest financial information, guidance and key figures 2019-2022.
Shares and trading
Trading with Lamor's share on the official list of Nasdaq Helsinki Ltd.: information on the shares and shareholding
Debt financing
Information on Lamor's debt financing incl. financial risk management, green finance framework and instruments.
Reports and presentations
Lamor’s financial performance, quarterly results and investor presentations.
Releases
Lamor's stock exchange, company and press releases. Other news and articles are available in the News section, accessible from the footer.
Governance
Lamor's Corporate Governance structure and the Code of Conduct.
IR Calendar and contacts
Browse Lamor's upcoming IR events and save them to your calendar.